Charts
Explore the four chart types on the Reports page -- call trends, duration distribution, peak hours, and agent performance.
Charts
Below the metric cards, the Reports page displays four charts arranged in a 2x2 grid. Each chart provides a different view of your call data for the selected date range.
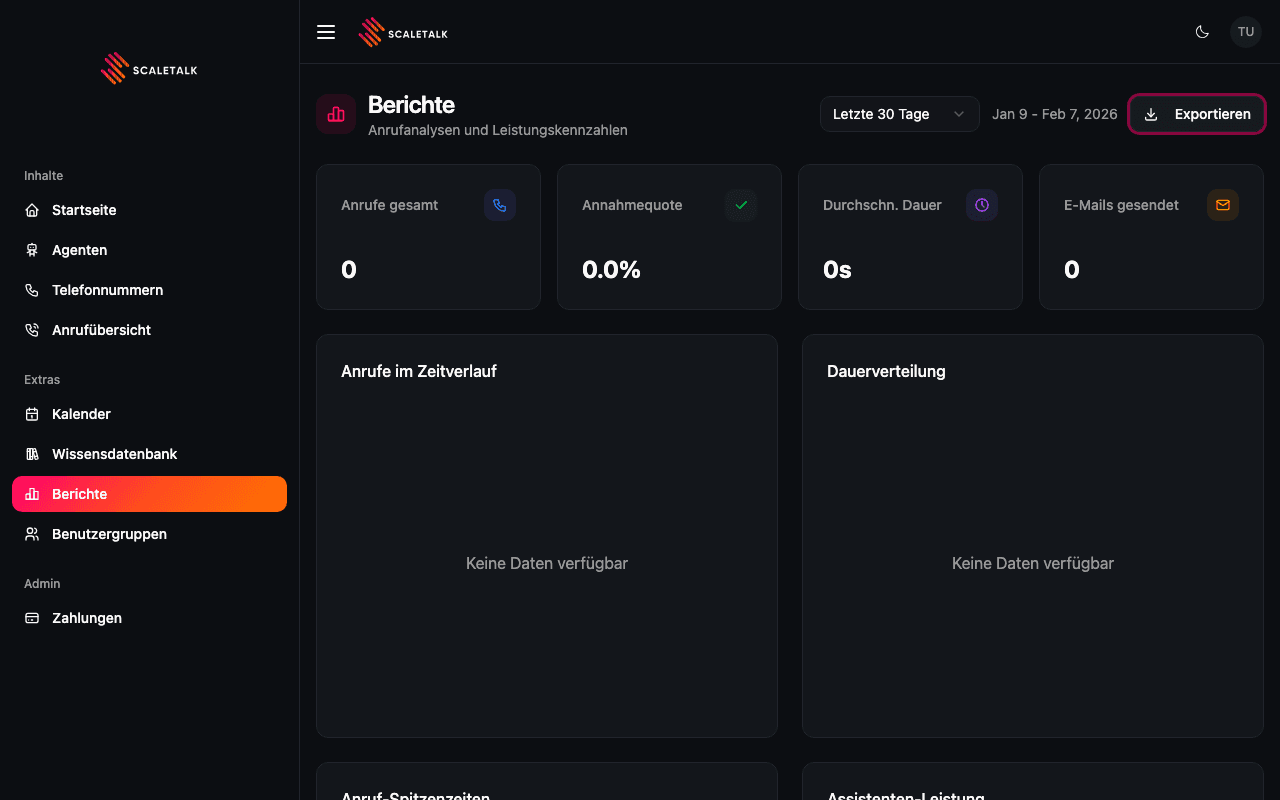
Calls Over Time
An area chart showing the number of calls per day across the selected period. The x-axis shows dates and the y-axis shows call counts.
Use this chart to:
- Spot trends in call volume (increasing, decreasing, or stable)
- Identify days with unusually high or low activity
- Correlate call spikes with marketing campaigns or external events
Tip
Hover over any data point to see the exact call count for that day.
Duration Distribution
A bar chart that groups calls into time buckets based on how long each call lasted.
| Bucket | Range |
|---|---|
| 0-30s | Very short calls (hang-ups, wrong numbers, quick answers) |
| 30s-1m | Brief interactions |
| 1-2m | Standard short calls |
| 2-5m | Medium-length conversations |
| 5m+ | Extended calls |
This chart helps you understand the typical call profile. A high concentration in the 0-30s bucket may indicate issues with your greeting or caller intent mismatch. A healthy distribution with calls spread across 1-2m and 2-5m usually indicates productive conversations.
Peak Hours
A bar chart showing call volume by hour of the day (00:00 through 23:00). All 24 hours are displayed, with hours that had no calls shown as zero.
Use this chart to:
- Identify your busiest calling hours
- Plan staffing for human backup during peak times
- Adjust agent availability or routing rules
Agent Performance
A table showing per-agent statistics including:
| Column | Description |
|---|---|
| Agent | Name of the AI agent |
| Calls | Total calls handled by this agent |
| Success Rate | Percentage of calls completed or answered (shown with a progress bar) |
| Avg. Duration | Average call length for this agent |
This view lets you compare how different agents perform relative to each other. Agents with lower success rates may need prompt adjustments or additional knowledge base content.
No Data
If any chart displays "No data available", there are no calls matching the selected date range. Try expanding the date range or verifying that your agents have active phone numbers.