Reports
Analyze call performance, track key metrics, and export data from the Reports dashboard.
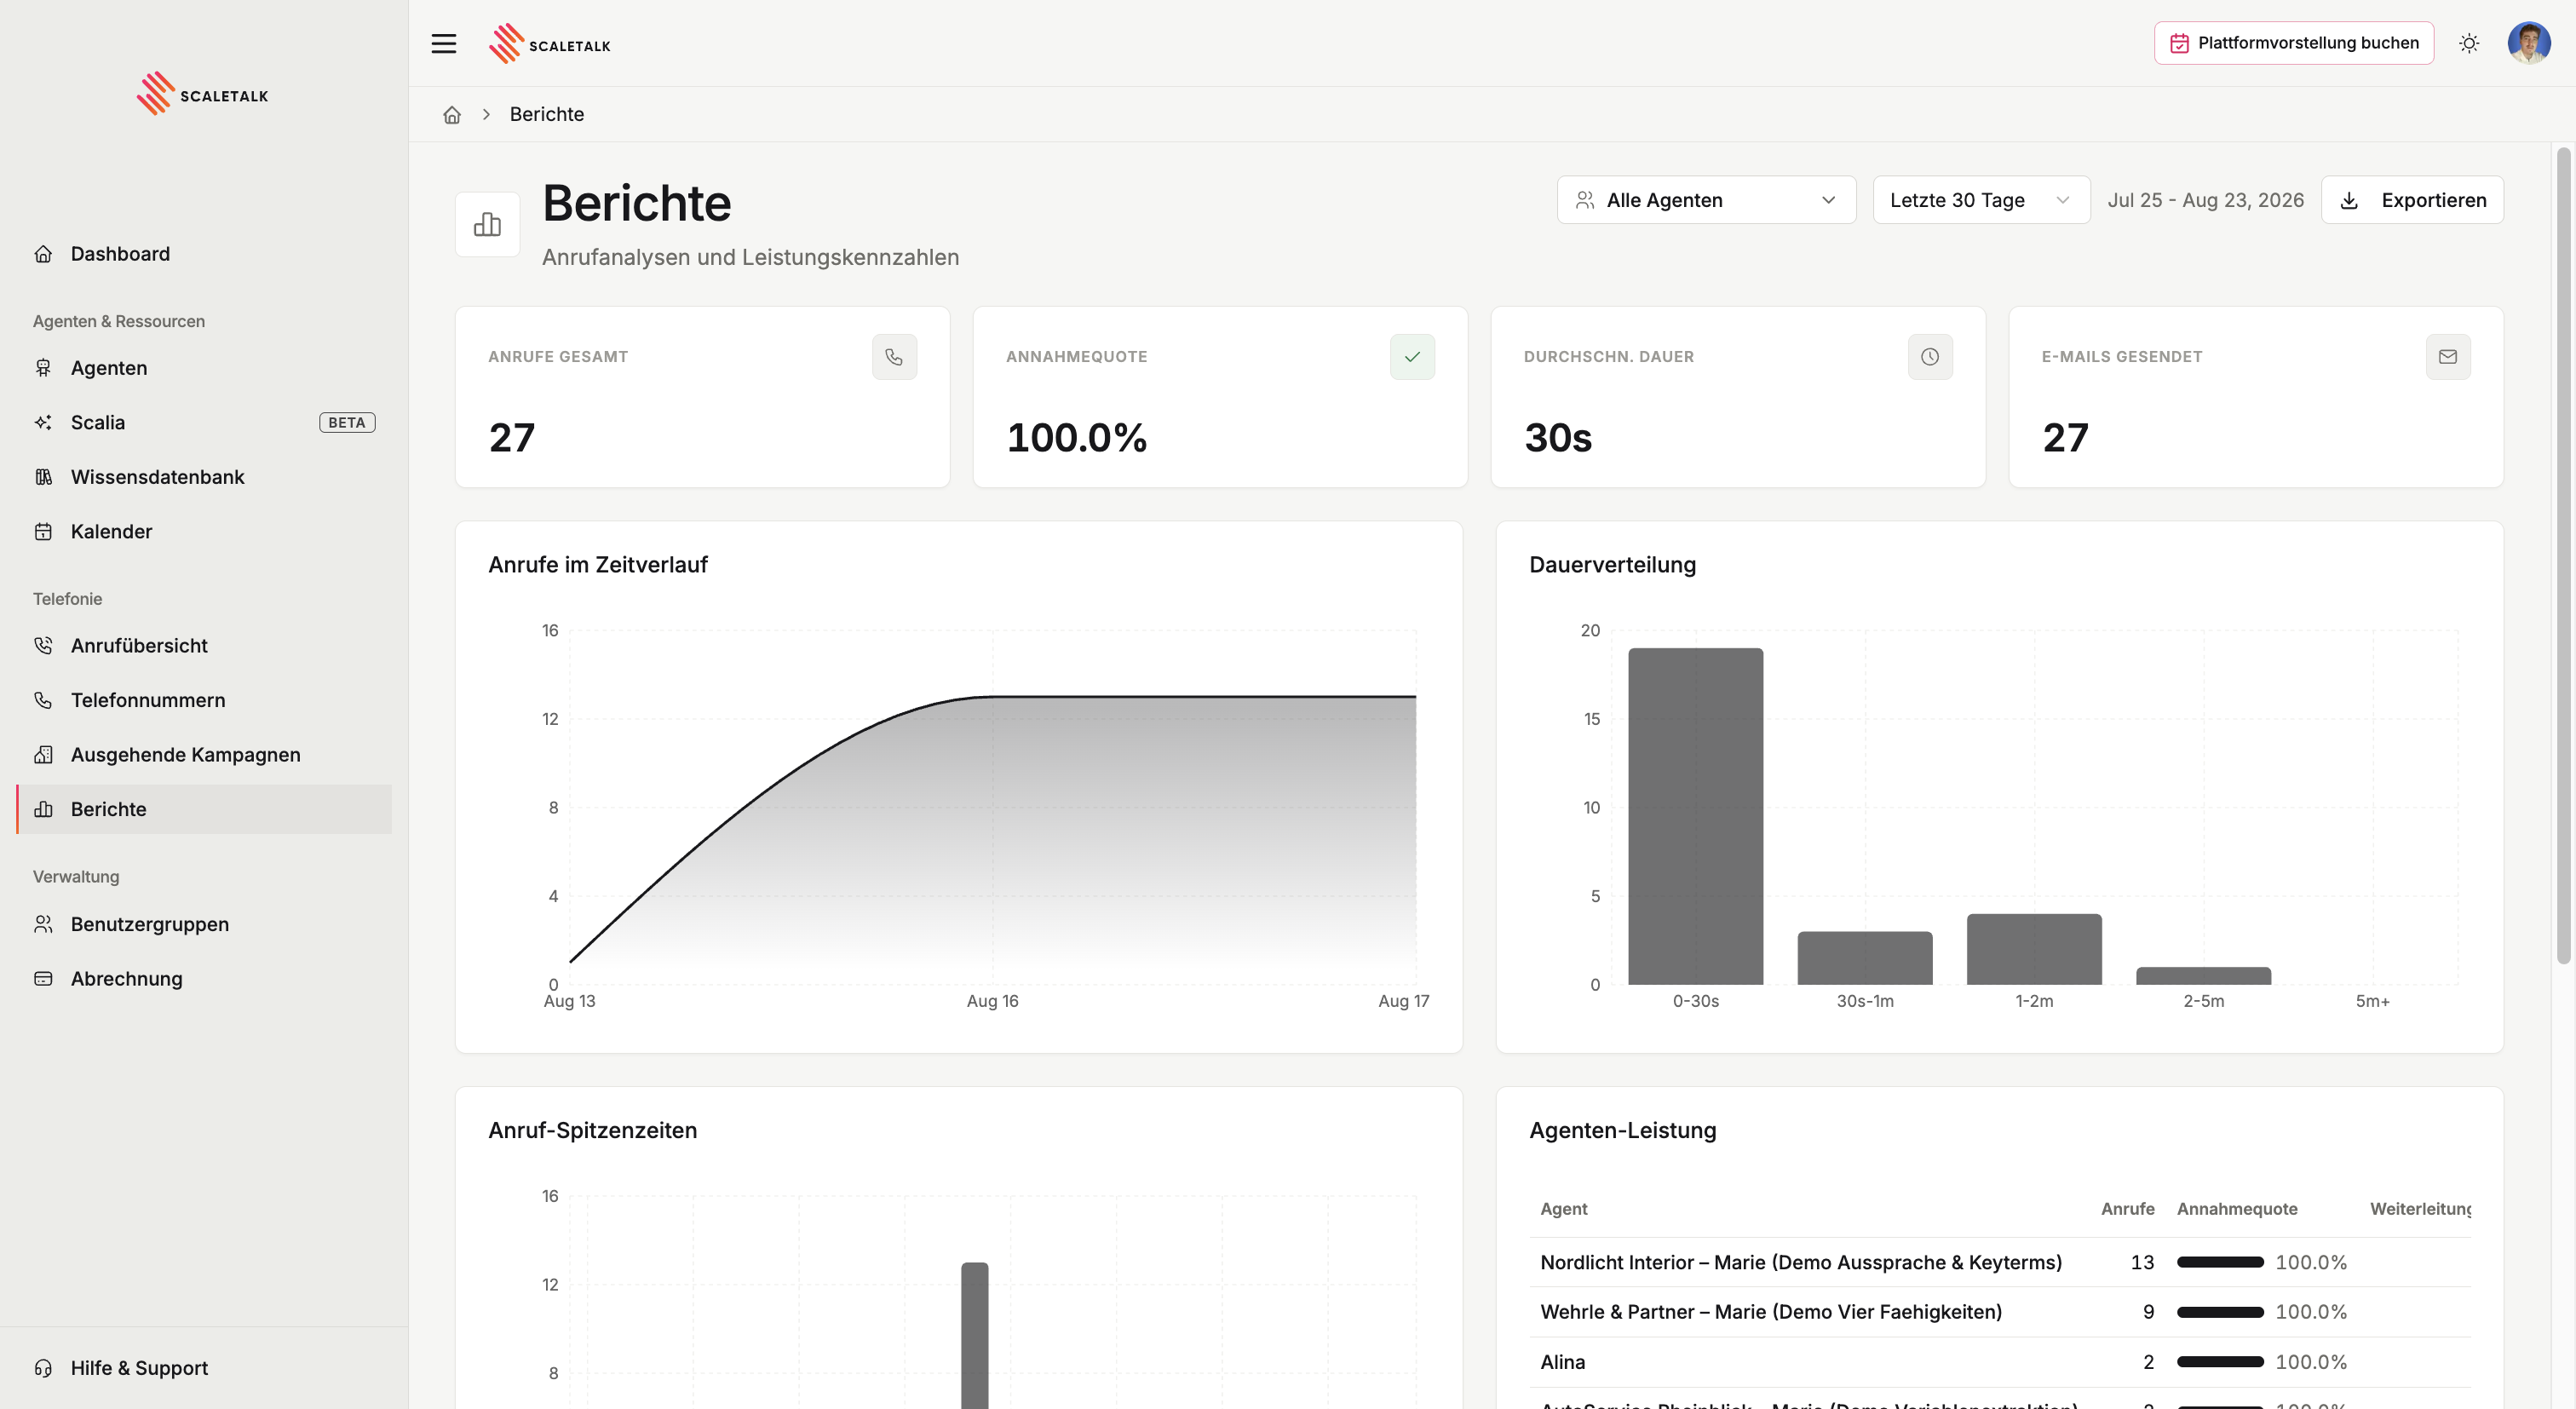
The Reports page gives you an overview of the performance of your voice AI agents. You can find it under the Reports menu item in the sidebar.
Metrics
At the top of the page, four KPI cards summarize your call data for the selected time period:
| Metric | Description |
|---|---|
| Total Calls | Total number of all calls in the time period |
| Answer Rate | Percentage of successfully completed or answered calls |
| Avg. Duration | Average call length (e.g., 2m 30s) |
| Emails Sent | Number of automatically sent follow-up emails |
Charts
Below the metrics, four charts are displayed:
- Calls Over Time — An area chart showing the daily call count. This helps you identify trends and spikes in call volume.
- Duration Distribution — A bar chart grouping calls by duration (0–30s, 30s–1m, 1–2m, 2–5m, 5m+). Many short calls under 30s may indicate issues with the greeting.
- Call Peak Hours — Shows call volume by time of day (0–23h) so you can identify your busiest hours.
- Assistant Performance — A table showing call count, success rate, and average duration per agent. Use this to compare the performance of your agents.
Filtering by Time Period
Use the time period selector in the top right to control which data is displayed. All metrics and charts update automatically.
Available presets: Today, Last 7 Days, Last 30 Days (default), This Month, Last Month, or a custom time period.
CSV Export
Click Export in the top right, then Download CSV to export the report data as a CSV file. The file contains all metrics, daily call counts, status distribution, duration distribution, and agent performance for the selected time period.
User Groups
If you belong to a User Group, the Reports page shows data for the group's agents. Use the group selector in the navigation bar to switch between personal and group data.